


Here in this Blog we will be understanding . why it is required and how it works.
Why it is required?????
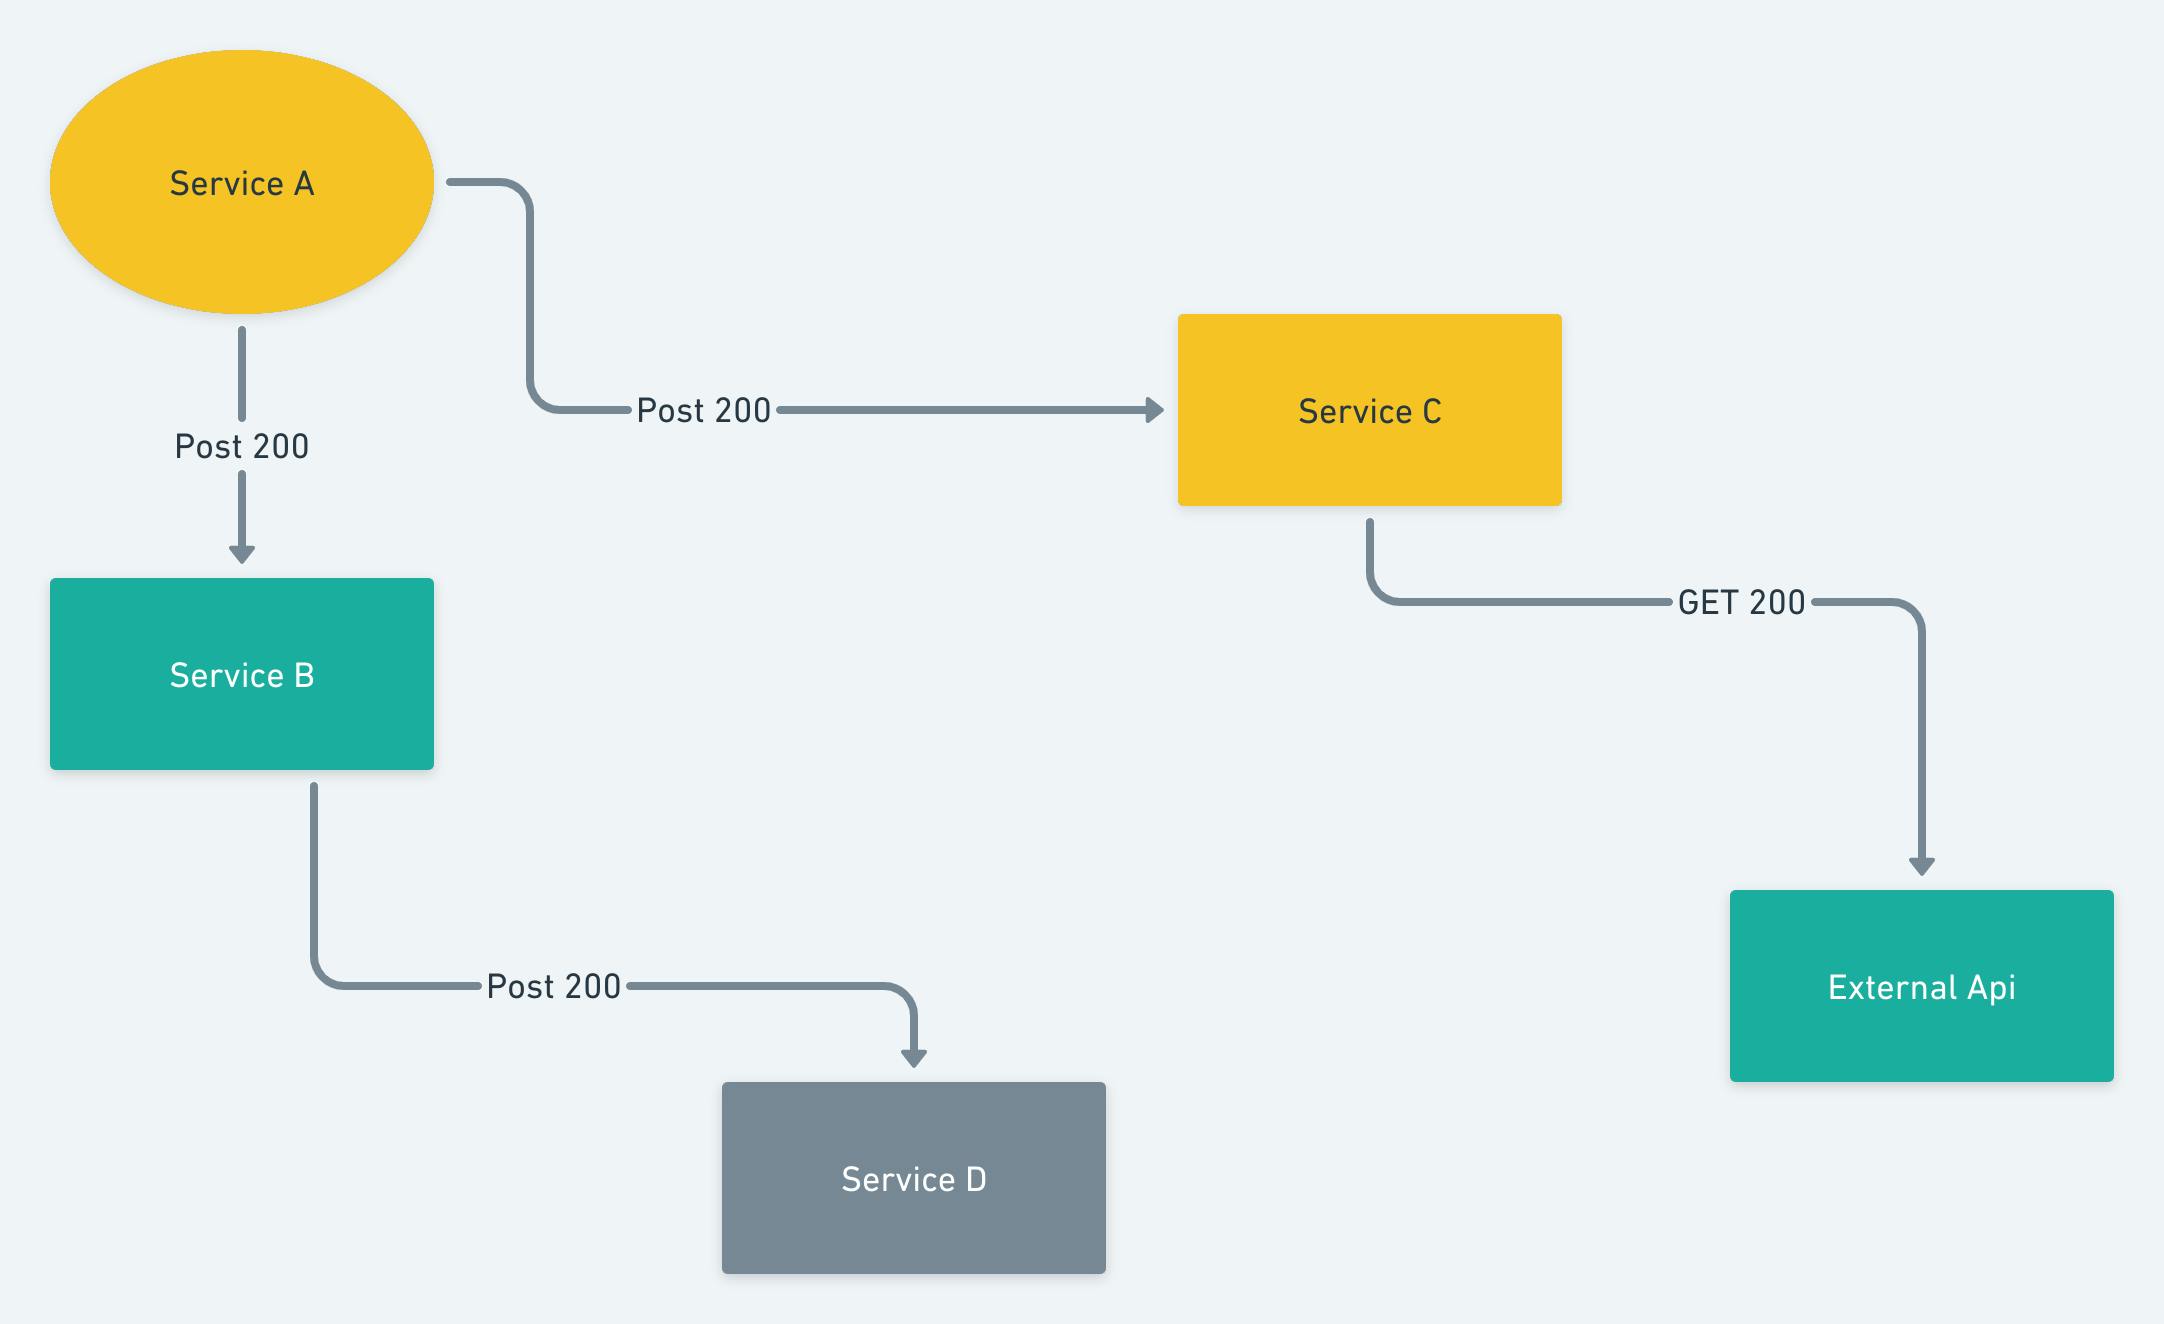
Let's assume a company is working on microservices (for assumption 4 services are there A,B,C,D. ). Here for a request service A is calling B and C, B again calling C and D services. so for monitoring purpose of requests and having good visualisation of the infra calls we need open-telemetry. Here we can understand how all requests are propagating and their taken times. so it easily gives a developer a good idea to optimise codes and debug the codes.
How it works????
Let's first see the architecture- Otel stack works with three layers -
- Application layer (where you have implemented the optl SDK's)
- Otel collector
- Visualiser
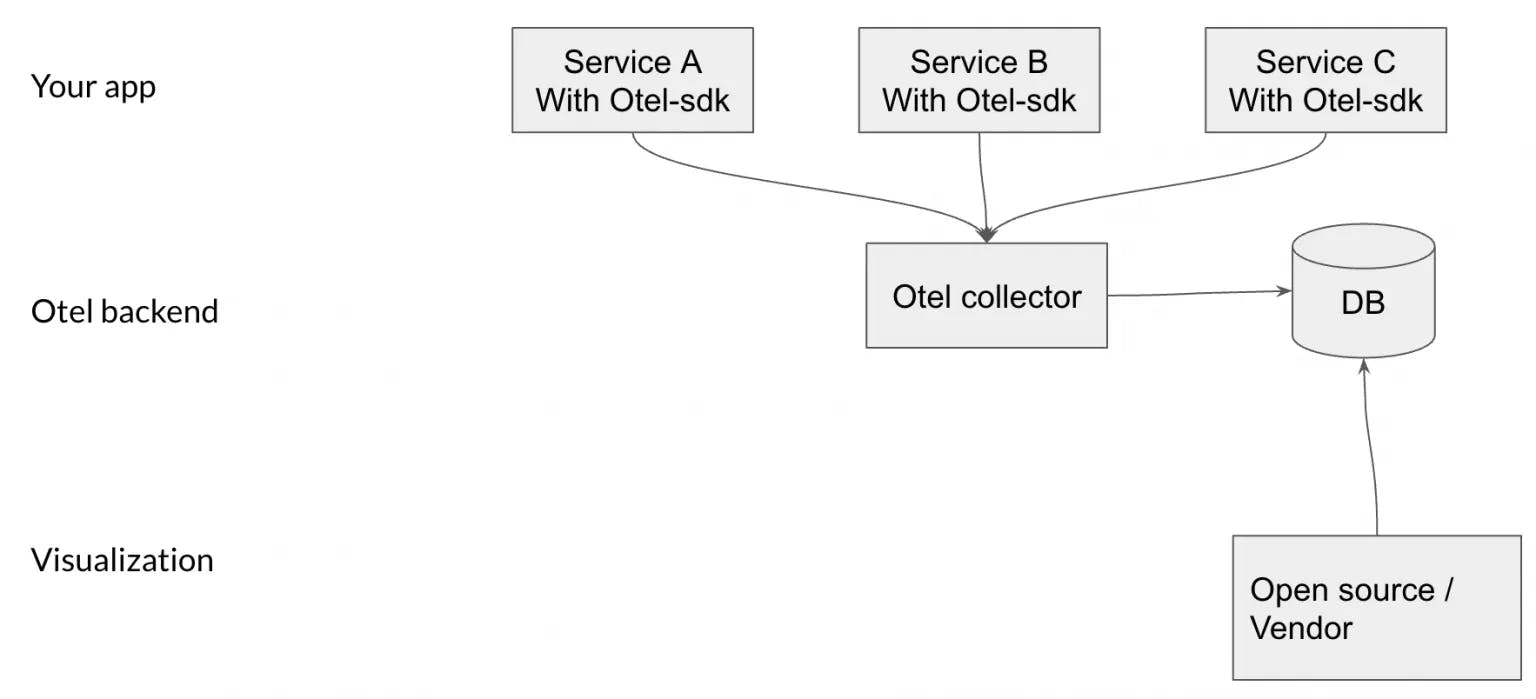
Application: As soon as otel SDK's are implemented with your application and Application starts, so it will start to sent the data of all microservices the otel collector.
Collector: Collector collect's the data and send to the backend to store it.
Visualiser: In this layer we can use any third party visualiser tool which will receives data from the backend. or any open end point.
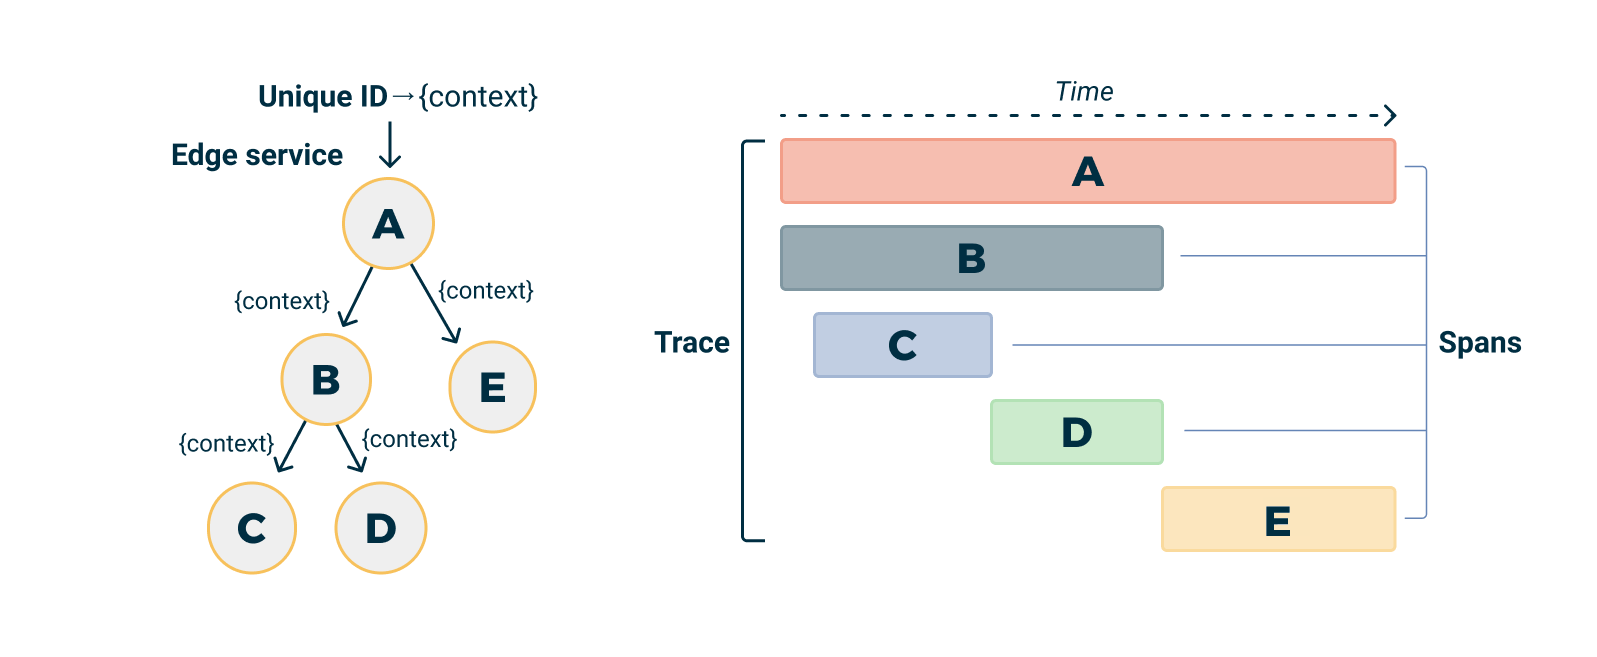
So here we have seen otel SDK's are coming in to the picture. let's find out how SDK's works here- Common terms will be used- Span: it is basic building block of open telemetry. a span is just a performed action on a service(POST,GET requests). Trace:A trace is a tree of spans representing the progression of a single request as it is handled by the different services of your app.
Now have a look on otel SDK's-
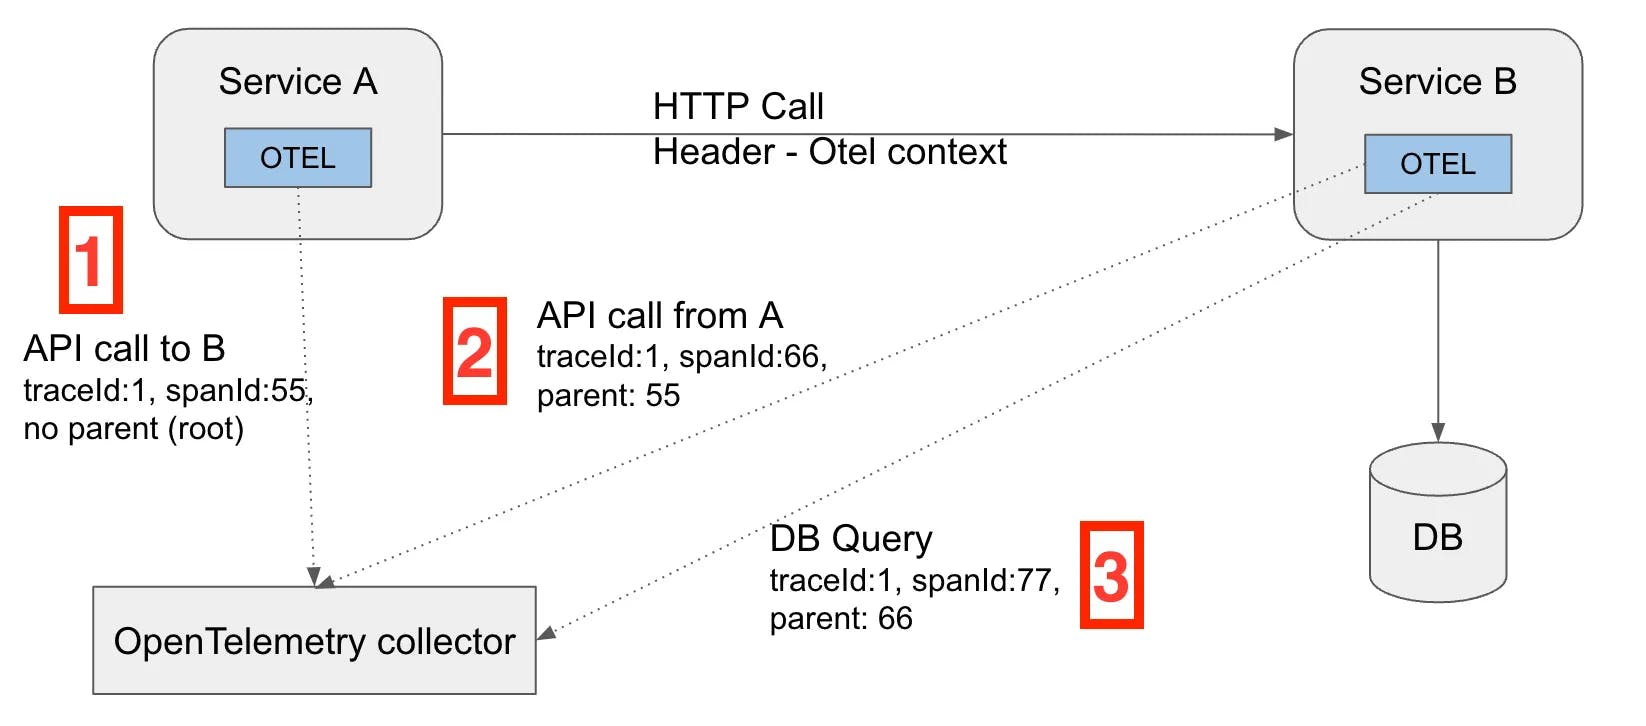
Here you can see there are two service A and B. and a is making Api call to the service B. after the api call service B is writing to the database. service A and B are having SDK's ang connected to the otel collector.
Once service A makes an API call to Service B, Service A also sends to the collector a span that describes the call to service B, essentially letting it know that it sent an API call (making it the parent in the trace).
There’s now a “parent / child” relationship between Service A and Service B (Service A being the parent of all the actions that follow).
OpenTelemetry injects the details about the parent span within the API call to Service B. It uses the HTTP headers to inject the trace context (trace ID, span ID, and more) into a custom header.
Once service B receives the HTTP call, it extracts the same header. From that point, any following action Service B takes is reported as its child.
All this magic happens out of the box.
This action brings another key aspect of OpenTelemetry – context propagation.
Essentially, it’s the mechanism that allows us to correlate spans across services. The context is transferred over the network using metadata such as HTTP headers.
The Header will include a trace ID, which represents the sequence of HTTP calls that were performed. It will also include a span ID, which represents the event – or span – that just took place.
Because service B has the SDK implemented as well, it will also send data to the collector, informing it that it has received an API call from service A (its parent).
The same goes for Service B’s call to the DB. It’ll create another span with the same trace ID as the initial trace ID created by service A.